Radon Gas Testing, Mold and Indoor Air Quality Inspections Dallas Houston Austin

Radon is one of the leading causes of lung cancer

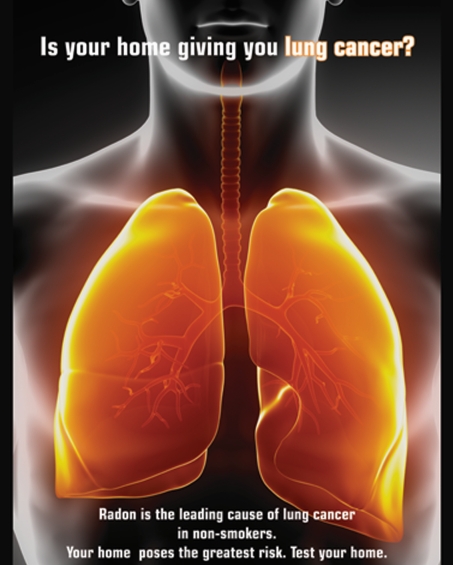
Radon gas in homes is one of the leading causes of lung cancer

Current MAP requirements allow a 25% ground floor sampling variance from the ANSI-AARST testing protocol.  However, if any of the units come back at or above 4 pCi/L, 100% ground floor testing is required. You can find the current radon policy in Chapter 9.5.C of the MAP guide: https://www.hud.gov/sites/documents/4430GHSGG-BM.PDF

Attached is a 2018 radon update from Pat Burke that supplements the existing policy:   Radon Technical Updates Pat Burke November 2018

Multifamily has proposed eliminating the 25% sampling variance and requiring 100% ground floor testing.  If approved, this change would go into effect when the new MAP guide is published.  The guide is still going through review. (from a memo dated Aug 5th, 2020)

The new requirement has now largely passed and is in effect as of this writing (January 1st, 2022) and because of the ongoing pandemic, ScanTech is no longer performing surveys for OCCUPIED multi-family dwellings or nursing facilities. We only perform commercial surveys in unoccupied structures which are typically new builds, though we can still do office buildings under certain conditions such as in conjunction with other forms of indoor air quality testing.  

Biomedical / Environmental Health & Safety Consulting & Field Testing With Industrial Hygiene & Microbiology expertise

Dallas Green Building Clearance Services – Certificate of Occupancy IAQ (Indoor Air Quality) VOC measurements for Dallas Green Building Ordinance Post-Construction with regards to Pre-Occupancy baseline IAQ testing Section 804.2.

In a rush to test your property for radon gas or radioactivity in natural stone such as granite or marble? Did you know that radon is the 2nd leading cause of lung cancer? (Smoking is 1st and radon gas synergistically increases mortality rates for smokers)

While it is not well known, radon gas levels EXCEED EPA action limits of 4 picoCuries/liter (pCi/L) in up to 10 % of all homes in Dallas county with an additional 14 % falling into the marginal range of 2 – 4 pCi/L. This means that 1 out of 4 homes (10 % + 14 % = 24%) in Dallas either have a radon issue or fall into a caution category. Other counties, such as Tarrant, Collin and Denton are not immune either. (see the link below on Radon FAQ from ScanTech for more details)

Example areas of the Metroplex (not a complete or comprehensive list) which have been found by ScanTech testing to have excess radon levels which are statistically higher than the 24 % quoted above include:

  • North Dallas and Far North Dallas
  • Lake Highlands
  • University Park
  • Highland Park
  • Park Cities area
  • Richardson
  • Arlington

ScanTech now has the capability to test and get results within as little as 24 hours of initial deployment using a high quality digital tester.

Our services are both faster and cheaper than competing methods or companies and we have been performing radon testing for homeowners in the DFW area for over 10 years.

Testing is performed by an engineering graduate experienced in radioactivity measurements,  indoor air quality testing including mold inspection, formaldehyde and radon gas testing.
AARST NRPP National Radon Testing Professional Certified

AARST-NRPP Nationally Certified Radon Residential Measurement Provider ID # 108991 RT* including Advanced Multi-Family & Large Buildings Radon Measurement MAMF-2017

*Meets HUD, Fannie Mae, Freddie Mac and GSA requirements

Mold Assessment Consultant – Texas Dept. of Health Service License # MAC1387 (now licensed by TDLR (Texas Dept. of Licensing & Registration)

(Activated charcoal short term radon test kits are accurate as well, but typically require at least 4 business days to get results under best case conditions and a complete kit deployment and pickup service is almost always more expensive due to the additional travel)

Call / text to 214.912.4691 – please include physical address, square footage property and email

More information is available here:

RADON FAQ Dallas /Fort Worth — DFW North Texas Area

http://www.indoorairqualitytestingdallas.com/

http://www.scantech7.com/formaldehyde-indoor-air-quality-testing-services-dallas-fort-worth/

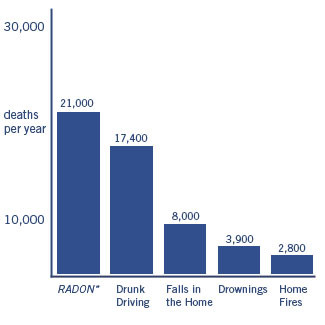
Radon Deaths United States Annually

Annual Radon Deaths Updated Chart

Texas CMIS Mold Information Sheet

Cities for radon / air quality inspection services include: Dallas, Austin, Houston, San Antonio, Spring, The Woodlands, Round Rock, Plano, Highland Park, University Park, Park Cities, Arlington, Fort Worth, Grapevine, Frisco, Denton, McKinney, Allen, Lewisville, Irving, Mesquite, Bedford, Euless, Richardson, Coppell, Grand Prairie, Garland, Addison, Farmers Branch, Rockwall, Carrollton, Parker, Rowlett, Lucas, Fairview, Park Cities, Keller, Roanoke, The Colony, Highland Village, Lake Dallas, Corinth, Prosper, Duncanville, Lancaster, Rowlett, Royse City, Trophy Club, Southlake and Hurst. Counties served include Dallas, Collin, Denton, Tarrant and Rockwall County.

*LEGAL NOTICE*

All information on this website either written or implied is the express opinion of ScanTech Technical Consulting. ScanTech Technical Consulting and it’s owners are not responsible or liable for any damages arising from the misuse, misinterpretation or other consequences of the content of this website either in part or in whole. This includes all external weblinks, PDF documents, photos or other references (informational or otherwise) to 3rd parties including government agencies, health organizations, etc.

15770 Dallas Pkwy Suite # 900      Dallas, TX 75248   (Not Accepting Visitors due to C19)

Phone: (214).912.4691      https://emfsurvey.com

ScanTech Technical Consulting: Professional Electromagnetic EMF EMI Testing for Biomedical Implant & Equipment, Indoor Air Quality (IAQ) Testing & Environmental Inspections

COPYRIGHT 2002 – 2022

Indoor Air Quality (IAQ) Testing Services (including chemicals / carcinogens like Formaldehyde) Available – Fast Onsite Results!

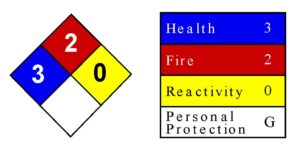
Formaldehyde NFPA Diamond from MSDS (Material Safety Data Sheet)

Formaldehyde NFPA Diamond from MSDS (Material Safety Data Sheet)

Dallas IAQ Green Building Clearance Testing for 804.2 Ordinance

Dallas Green Building IAQ Indoor Air Quality Clearance Testing Post-Construction for 804.2 Certificate of Occupancy

ScanTech Technical Consulting performs indoor air quality tests including particulate matter in the air (residential and commercial) in the 0.3 – 2.5 micron and 2.5 micron + range  (PM 2.5 and PM10) in order to evaluate how clean your air is with respect to dust and other fine particles. We also offer formaldehyde and VOC levels testing due to chemicals used in the manufacture of pressed wood flooring, lumber, laminates, glues and other adhesives in your home and factory/office.

More information on formaldehyde can be found here:

https://emfsurvey.com/formaldehyde-indoor-air-pollutant-and-testing/

We can also test for VOCs, (Volatile Organic Compounds) CO2 (Carbon Dioxide) levels and O2 oxygen levels in your home to check ventilation quality. Datalogging over time available to show trends and measure the effects of HEPA filtration and electrostatic air ionization units.

Our background in organic and environmental chemistry, epidemiology, advanced microbiology, medical geology  and human physiology makes us uniquely qualified to answer your concerns regarding the invisible environment you breathe every day.

July 2016 ruling by the EPA on the emissions of formaldehyde of wood products produced or imported into the United States:

https://www.epa.gov/formaldehyde/formaldehyde-emission-standards-composite-wood-products-0#additional-resources

The following tables and information are from:

Health Effects Notebook for Hazardous Air Pollutants

To convert concentrations in air (at 25°C) from ppm to mg/m3: mg/m3 = (ppm) × (molecular weight of the compound)/(24.45) For formaldehyde which is CH20: 1 ppm = 1.23 mg/m3.

Explanation of Formaldehyde Levels

Formaldehyde Regulatory and Health Levels Comparison

Formaldehyde Regulatory & Health Levels Comparison

AIHA ERPG–American Industrial Hygiene Association’s emergency response planning guidelines. ERPG 1 is the maximum airborne concentration below which it is believed nearly all individuals could be exposed up to one hour without experiencing other than mild transient adverse health effects or perceiving a clearly defined objectionable odor; ERPG 2 is the maximum airborne concentration below which it is believed nearly all individuals could be exposed up to one hour without experiencing or developing irreversible or other serious health effects that could impair their abilities to take protective action.

ACGIH STEL–American Conference of Governmental and Industrial Hygienists’ short-term exposure limit expressed as a time-weighted average exposure; the concentration of a substance which should not be exceeded at any time during a workday.

LC50 (Lethal Concentration50)–A calculated concentration of a chemical in air to which exposure for a specific length of time is expected to cause death in 50% of a defined experimental animal population.

NIOSH IDLH–National Institute of Occupational Safety and Health’s immediately dangerous to life or health limit; NIOSH recommended exposure limit to ensure that a worker can escape from an exposure condition that is likely to cause death or immediate or delayed permanent adverse health effects or prevent escape from the environment.

NIOSH REL–NIOSH’s recommended exposure limit; NIOSH recommended exposure limit for an 8- or 10-h time-weighted average exposure and/or ceiling.

OSHA PEL–Occupational Safety and Health Administration’s permissible exposure limit expressed as a time-weighted average; the concentration of a substance to which most workers can be exposed without adverse effect averaged over a normal 8-h workday or a 40-h workweek.

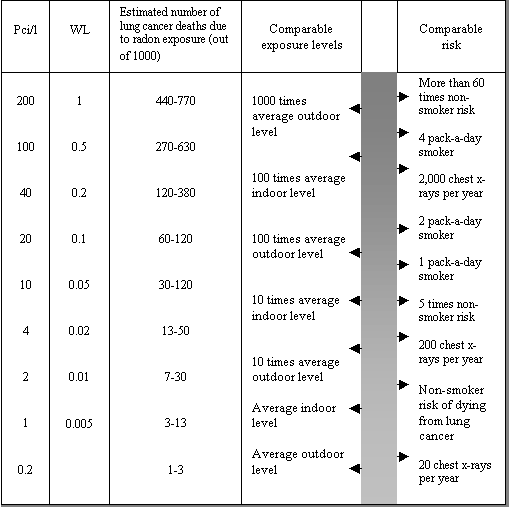
Radon Gas Risk Factor Safety Levels Comparison

How do you put the risk from radon into perspective, especially since all homes contain some level of radon gas in them and there is no “safe level” except zero?

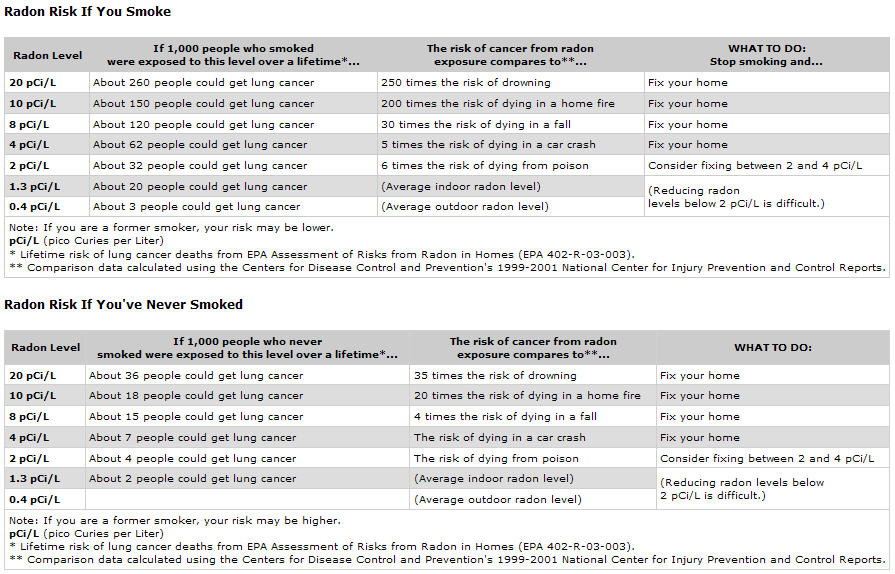
I have found the following charts to be helpful in evaluating risk: (please click on the pictures for a full sized detailed view)

Radon Gas Cancer Radiation Risk Safety Dallas Houston Austin

Radon Gas Chart Safety Level Relative Risk Factors

Texas CMIS Mold Information Sheet

Radon Gas Cancer Risk Smokers Non-Smokers Chart

Radon Cancer Risk Chart for Smokers vs. Non-smokers

Notice that the risk for a radon level at the EPA action limit of 4 picoCuries/liter is similar to the same risk of dying in a car wreck. I have personally observed several residences that I have tested in Dallas county to EXCEED this limit including my own home.

Radon is linked to not just lung cancer, but recent epidemiological evidence also suggests that radon gas may also be a risk factor and contributor to

  1. Acute Myeloid Leukemia (AML)   13 % – 25 % of all cases worldwide.
  2. Kidney cancer
  3. Certain childhood cancers
  4. Melanoma

Radon Gas Testing Methods & Equipment

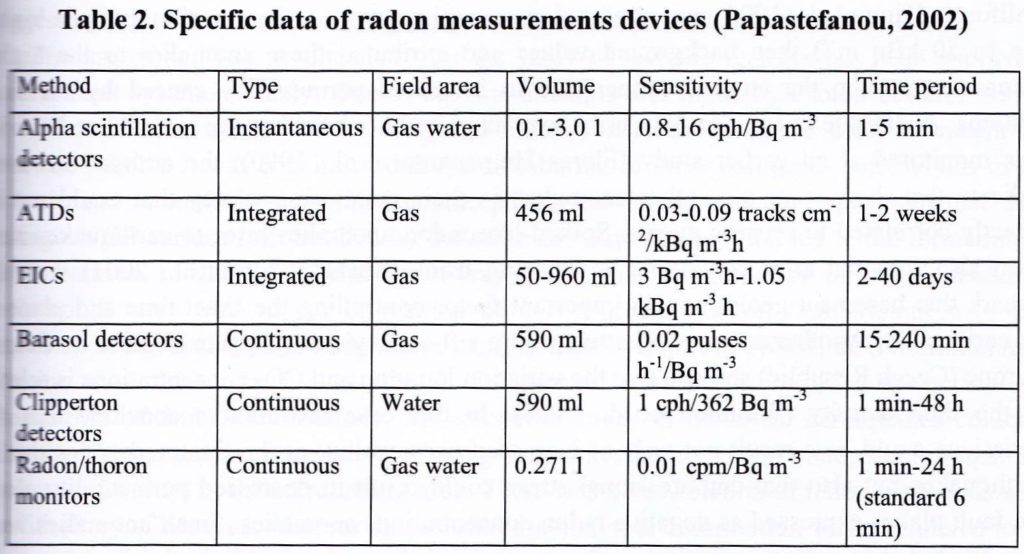
There are a variety of ways to monitor the radon levels in a residence, home or commercial building and the best detector for your needs depends on balancing cost, accuracy, ease of use and type of application such as a long or short term test.

The chart below gives a comparison of different detectors including the time period duration during which radon is measured.

Comparison of Different Radon Detection Methods

Comparison of Different Radon Detection Methods

Radon & Radioactivity Measurement Safety Guide

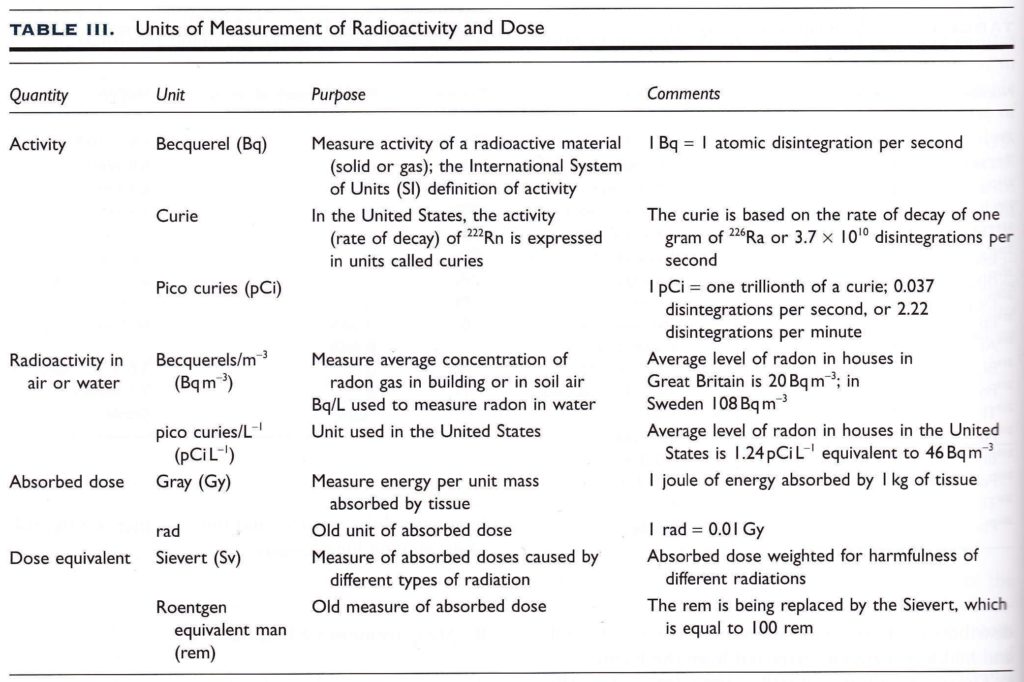
Measuring radioactivity from radon is potentially very confusing for the lay person for several reasons. One of which is that there are several different units of measurement depending on the application, era of standards and preference based on world regionalisms. Applications include activity, (which radon measurement falls under) absorbed dose, which is the measure of radioactive energy absorbed by tissue per unit mass and dose equivalent which is the measure of absorbed doses from DIFFERENT types of radioactivity such as alpha, beta, and gamma radiation. Many scintillation meters still measure this in the older measurement unit rem (Roentgen Equivalent Man) or microrems for gamma radiation.

For instance, when measuring radon, North America prefers to use the picoCuries per liter (pCi/L) designation as opposed to Becquerels  or Bq / meter^3 which is typically used in Europe and the UK. These both measure a specific number of atomic disintegrations per volume of space.

In the case of the Becquerel, this is 1 atomic disintegration per second or 60 events per minute. For a picoCurie, this is translated as 2.2 radioactive disintegrations per minute. A convenient conversion chart is shown below.

Just as a quick conversion from the picoCurie/liter to the Becquerel / m^3:

1 picoCurie / liter = ~ 37.1 Bq/m^3     EPA action limit 4 pCi/L = ~ 148.4 Bq/m^3

Units of Measurement for Radioactivity and Dose

Units of Measurement for Radioactivity and Dose

As an added note, a little known unit of radon is what is known as a Working Level (WL) which is the quantity of radon that will produce 1.3 X 10^5 MeV (Mega Electron Volts) of potential alpha particle energy per liter of air. A single WL of radon is equal to the RDP’s (Radon Decay Products) in equilibrium with 100 pCi/L of radon. Because the equilibrium value for RDP’s for indoor environments is typically 0.5, radon concentrations of 1 WL would be around 200 pCi/L.

Nuclear Radiation Surveys and Testing Nuclear / Ionizing Radiation including NORM, TENORM

EMF EMI Testing Magnetic – Electric Field – RF Radiation NIRAD : PART 1

Entry Routes and Factors Affecting Indoor Radon Levels in Homes

Many people wonder how radon gas levels could be present in Dallas / Fort Worth Metroplex DFW area – how does it get inside your home and affect your health and safety?

The fact is that all parts of the Earth, regardless of geography, have some level of background radiation due to nuclear disintegrations of naturally occurring radionuclides (radioactive isotopes) including uranium in the soil, water and air. On average, rocks contain only about 1-3 ppm of uranium, though some species have as much as 100 ppm. These are typically metamorphic minerals such as granite, black shale, schist, gneiss, phosphorites, some sedimentary rock (including limestone in some cases) with a high phosphate content and metamorphic rocks derived from these rocks.

On average worldwide, the radioactive concentration of U-238, Thorium-232 and Radium-226 are ~0.65 pCi (picoCuries) per gram though this can vary significantly in very localized areas.

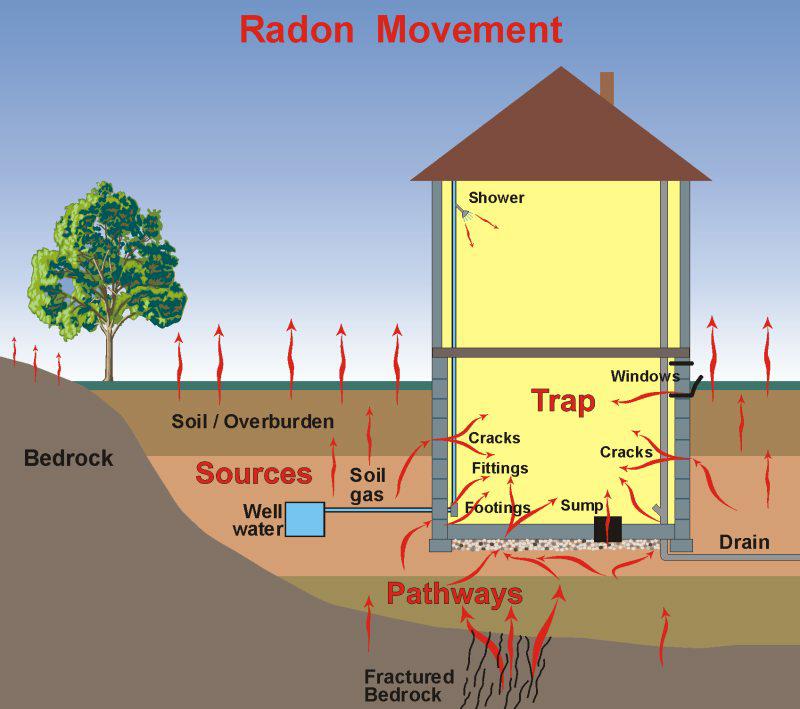
Radon geology home construction

Radon Intrusion Paths into Home

The major source of indoor radon is soil gas transported by pressure-induced convective flows (as shown in the illustrations) with potential entry points marked. Radon transport is enhanced when the base of the building is under significant negative pressure. Homes built on soils with higher radon release (based on soil type, porosity, pore volume, water content, etc.) and convection based transport are typically more sensitive to atmospheric factors such as temperature, wind and barometric pressure. Radon movement through soil can also occur through diffusion or both diffusion and convection.

Homes built on soils with a higher clay content (as opposed to those with sandy / gravelly soils) tend to have lower radon gas levels, but there may be trade-offs with higher moisture levels which can give rise to issues with mold, dust mites and general structural deterioration.

What are the major entry routes into your home?

1) Cracks in concrete slabs

2) Spaces behind brick veneer walls that rest on uncapped hollow-block foundations.

3) Pores and cracks in concrete blocks.

4) Floor wall joints.

5) Exposed soil as a sump.

6) Drain tile, if drained to an open sump.

7) Mortar joints.

8) Loose fitting pipe penetrations.

9) Building materials including some rocks and other decorative stones such as marble and granite.

10) Drinking / tap water.

11) Open tops of block walls.


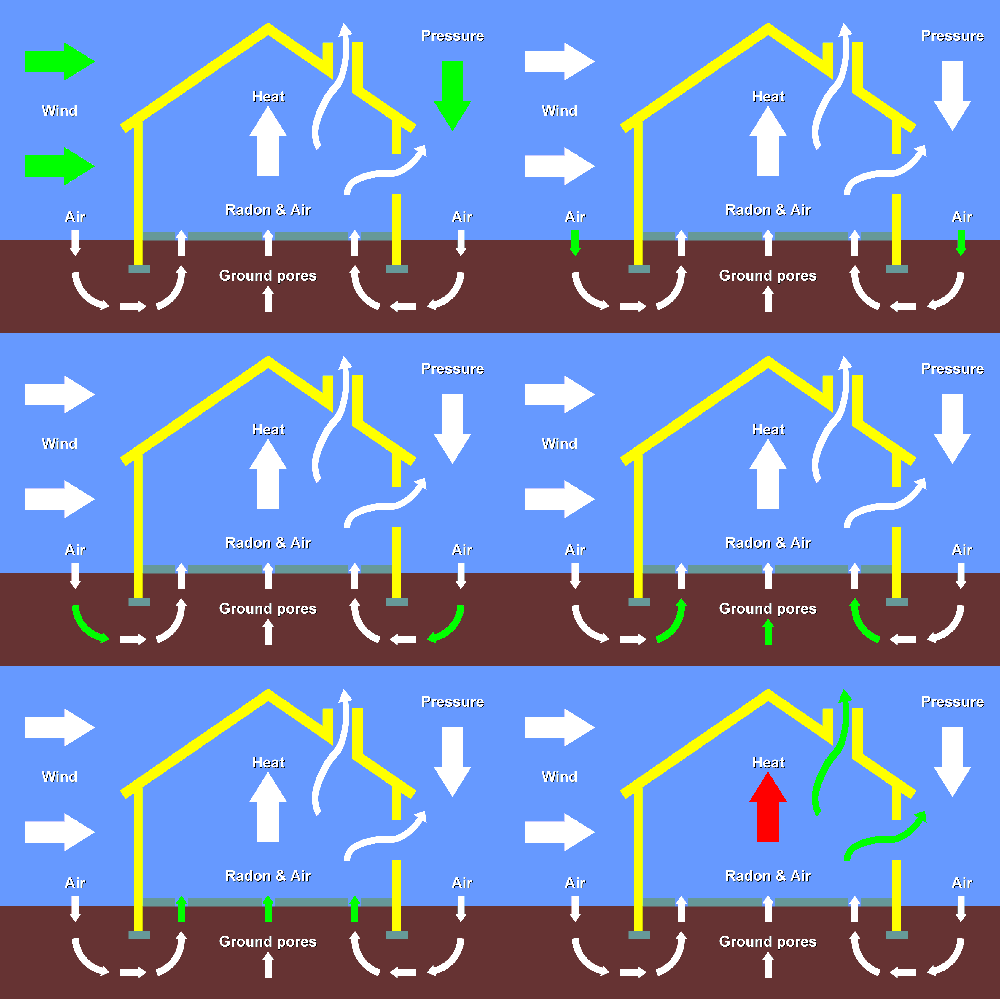
Atmospheric Factors with Radon Levels in Homes

Atmospheric Factors with Radon Levels in Homes (Animated Graphic)

What factors affect indoor radon overall?

1) Low ventilation rates.

2) The nature of soil permeability. (by diffusion / convection mechanisms)

3) Construction materials used. Can be a significant factor in natural stone where Radium-226 concentrations are elevated. (exceed 1 pCi/gm or 1 picoCurie per gram) Emanation depends on radium density and material porosity.

4) Home water supply.

5) Meteorology (such as temperature, pressure and humidity) and the local geology of the environment.

6) Soil radon production rates based on radioactive material composition (most in the U.S. have base radon concentrations between 200 – 2000 pCi/L)

7) Cracks and fissures in the underlying geology

8) Building substructure (slab on grade, pier and beam, basement, etc.)

EPA Working to Make the Public Aware of Radon Gas Risk in Homes – North Texas News Story

A local Texas story about radon wherein a local Dallas woman found twice the EPA action limit in her home after she was told residential home testing wasn’t necessary:

A Story of Elevated Radon in Dallas – The Cancer Risks

I have personally verified a number of homes that exceeded the EPA action limit including one that had radon levels even higher than mentioned in the article.

So Much of Texas is Considered Zone 3: Is it Safe? (free from Radon Gas)

I recently had a client inquire about my services and asked for an official proposal. Before I could respond, within 30 minutes they sent a follow up message saying that because the Dallas / Fort Worth area is considered a Zone 3 region according to the EPA, that testing isn’t necessary.

This is a serious misunderstanding of what the different radon gas Zone designations mean, even according to the Environmental Protection Agency which states explicitly on their website:

“All homes should be tested, regardless of zone designation.”

http://www.epa.gov/radon/pdfs/statemaps/texas.pdf

“All homes should test for radon, regardless of geographic location or zone designation.”

http://www.epa.gov/radon/zonemap.html

While a structure located in Zone 3 has a statistical likelihood of having a lower level of radon, there are still thousands of homes, residences and structures in the DFW area that will exceed the action limit of 4.0 picoCuries per liter if tested. I have found several myself in the course of testing as this percentage of homes is 10 %. It is not probable, but a 1 in 10 chance is fairly high when gambling against the chance of lung cancer.

I have found a number of homes in the North Dallas area (including mine) whose radon levels are high enough to warrant mitigation. With radon gas now killing more people than drunk drivers, it is well worth the small investment to get your residence checked.

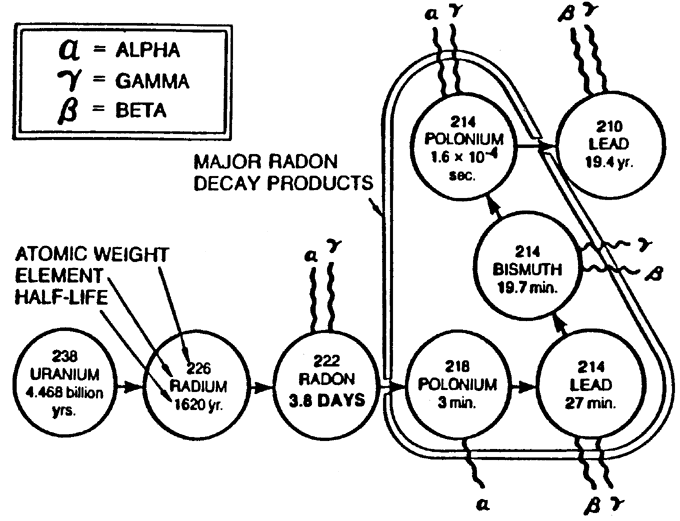
Radon: The Radioactivity Decay Pathway

Below is a detailed chart showing the radioactivity pathway to radon from the original U-238 atom. Also shown are the different types of radiation:

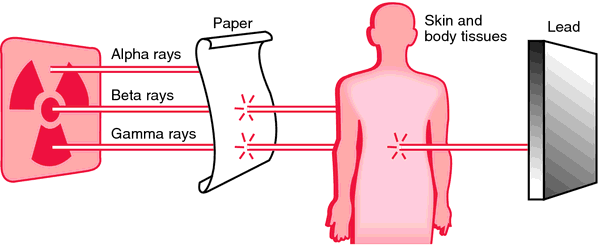
Alpha Radiation – (from Radon-222 as an example) high energy helium nuclei (almost no penetrating power, but does a great deal of damage at close range to cells and DNA – will not penetrate outer layer of skin, but can cause direct harm to epithelial cells in the lungs if inhaled) It causes approximately 5 X the damage of gamma Radiation or X-Rays.

Beta Radiation –  high energy electron (much lighter than an alpha particle but it has a greater penetration)

Gamma Radiation – high energy photon (essentially without mass but has a high penetration factor through shielding)

Penetration and of Alpha, Beta and Gamma Radiation

Penetration and of Alpha, Beta and Gamma Radiation

If you follow the diagram below, the radioactive decay of Radon-222 to Lead-210 results in the emission of 3 alpha particles, 2 beta particles and a discrete amount of gamma radiation. (the nature of which is an electromagnetic wave, not a particle) Because radon decay products (RDPs) are electrically charged particles, they readily adhere to suspended dust particles (which can be inhaled) or other surfaces in a phenomena known as “plate-out”. Either pure RDPs or the particles they are attached to can be inhaled.


Radon gas decay pathway

Radon Gas Decay Chart

Medical Geology Post on Environmental Radon

General radon levels in the environment can vary greatly, depending on locale and the medium it is measured in. Here are comparisons between indoor/outdoor air, soil air and groundwater.

Again, the conversion factors are from the picoCurie/liter to the Becquerel / m^3:

1 picoCurie / liter = ~ 37.1 Bq/m^3     EPA action limit 4 pCi/L = ~ 148.4 Bq/m^3


Radon:  Outdoor air      Low of 4 – 8 Bq / m^3    =  0.2 – 0.3 picoCuries/liter

High of 100 Bq / m^3 in valleys (morning time)  = 2.7 picoCuries / liter

Radon:  Indoor air  Low  20 Bq / ^3  = 0.5 pCi/l

High of 110000 Bq / m^3  = 2964 pCi/l  (probably over a uranium mine)


World average  39 Bq / m^3   = 1.1 pCi/l


EXAMPLE INDOOR RADON LEVELS by Country: Average

Egypt:   9 = 0.2 pCi/l

UK:  20 =  0.5 pCi/l

USA:  46 = 1.5 pCi/l     Texas  48 = 1.3 pCi/l

United States by Region:  (geometric mean values)  3.43 pCi/L in the Northeast   2.36 pCi/L in Midwest, 0.64 in the Northwest, 2.40 pCi/L in the Mountain States, 1.43 pCi/L in the Southeast

Sweden:  108   = 2.9 pCi/l

Czech Republic: 108 = 2.9 pCi/l

Highest ever radon concentration ever reported in an indoor dwelling:   2600 pCi/L in a southeastern Pennsylvania home which is equal to a 4 pack a day smoker.

Radon in soil air:   Ranges from less than 1 to over 2500 Bq / liter  = 0.03 – 67.4 pCi/l

Most soils in the USA are between 5 – 55  Bq/liter  = 0.13 – 1.48 pCi/l

Radon in groundwater:  3 – 80000 Bq/liter  = 0.081 – 2156 pCi/l