Many people wonder how radon gas levels could be present in Dallas / Fort Worth Metroplex DFW area – how does it get inside your home and affect your health and safety?
The fact is that all parts of the Earth, regardless of geography, have some level of background radiation due to nuclear disintegrations of naturally occurring radionuclides (radioactive isotopes) including uranium in the soil, water and air. On average, rocks contain only about 1-3 ppm of uranium, though some species have as much as 100 ppm. These are typically metamorphic minerals such as granite, black shale, schist, gneiss, phosphorites, some sedimentary rock (including limestone in some cases) with a high phosphate content and metamorphic rocks derived from these rocks.
On average worldwide, the radioactive concentration of U-238, Thorium-232 and Radium-226 are ~0.65 pCi (picoCuries) per gram though this can vary significantly in very localized areas.
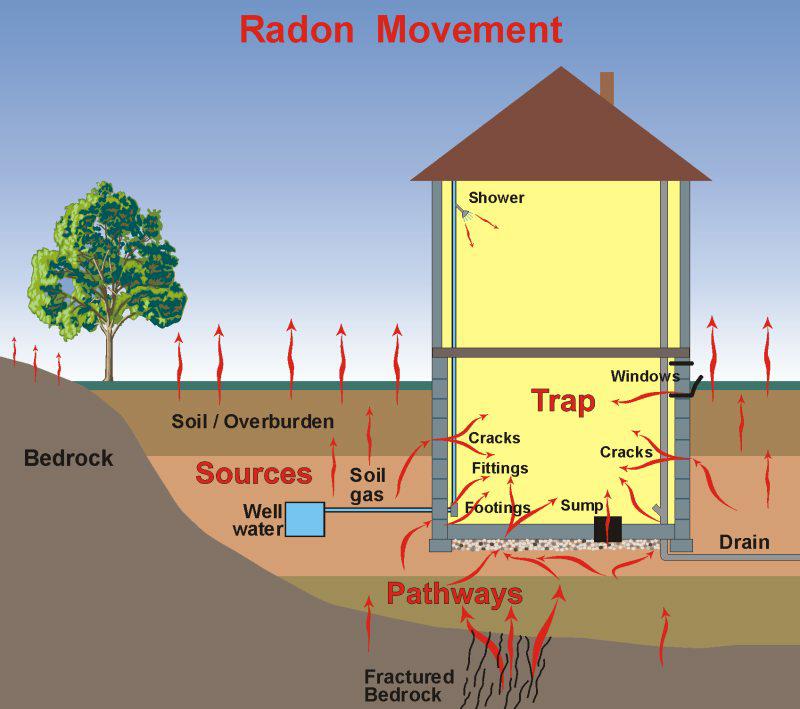
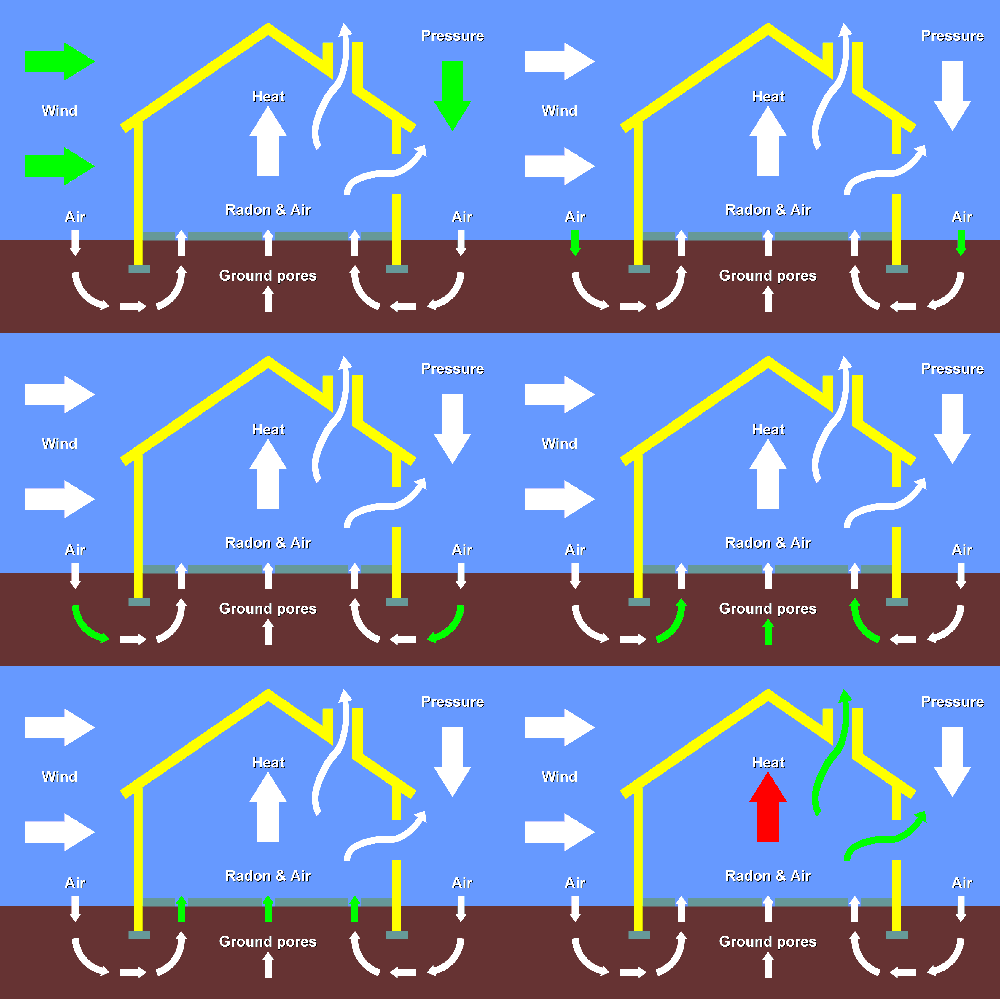
The major source of indoor radon is soil gas transported by pressure-induced convective flows (as shown in the illustrations) with potential entry points marked. Radon transport is enhanced when the base of the building is under significant negative pressure. Homes built on soils with higher radon release (based on soil type, porosity, pore volume, water content, etc.) and convection based transport are typically more sensitive to atmospheric factors such as temperature, wind and barometric pressure. Radon movement through soil can also occur through diffusion or both diffusion and convection.
Homes built on soils with a higher clay content (as opposed to those with sandy / gravelly soils) tend to have lower radon gas levels, but there may be trade-offs with higher moisture levels which can give rise to issues with mold, dust mites and general structural deterioration.
What are the major entry routes into your home?
1) Cracks in concrete slabs
2) Spaces behind brick veneer walls that rest on uncapped hollow-block foundations.
3) Pores and cracks in concrete blocks.
4) Floor wall joints.
5) Exposed soil as a sump.
6) Drain tile, if drained to an open sump.
7) Mortar joints.
8) Loose fitting pipe penetrations.
9) Building materials including some rocks and other decorative stones such as marble and granite.
10) Drinking / tap water.
11) Open tops of block walls.
What factors affect indoor radon overall?
1) Low ventilation rates.
2) The nature of soil permeability. (by diffusion / convection mechanisms)
3) Construction materials used. Can be a significant factor in natural stone where Radium-226 concentrations are elevated. (exceed 1 pCi/gm or 1 picoCurie per gram) Emanation depends on radium density and material porosity.
4) Home water supply.
5) Meteorology (such as temperature, pressure and humidity) and the local geology of the environment.
6) Soil radon production rates based on radioactive material composition (most in the U.S. have base radon concentrations between 200 – 2000 pCi/L)
7) Cracks and fissures in the underlying geology
8) Building substructure (slab on grade, pier and beam, basement, etc.)


