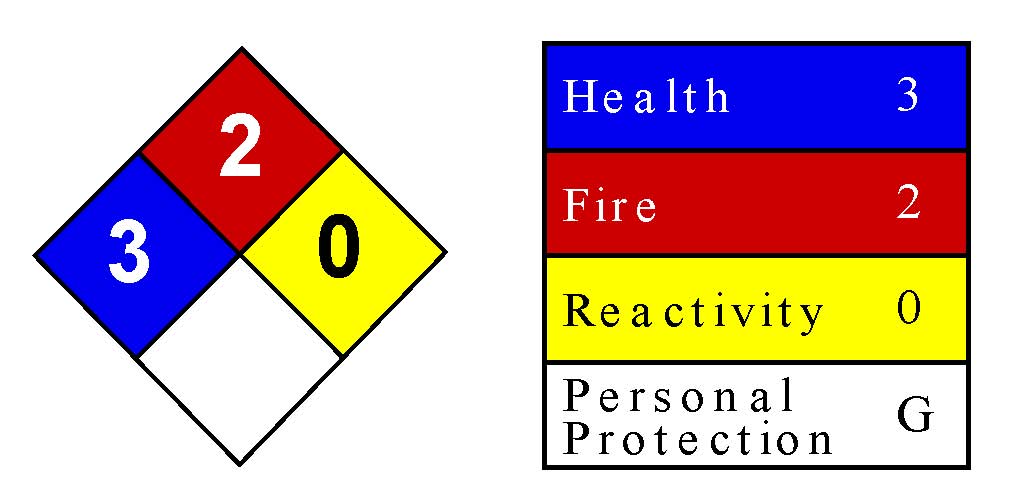
Formaldehyde NFPA Diamond from MSDS (Material Safety Data Sheet)
Dallas IAQ Green Building Clearance Testing for 804.2 Ordinance
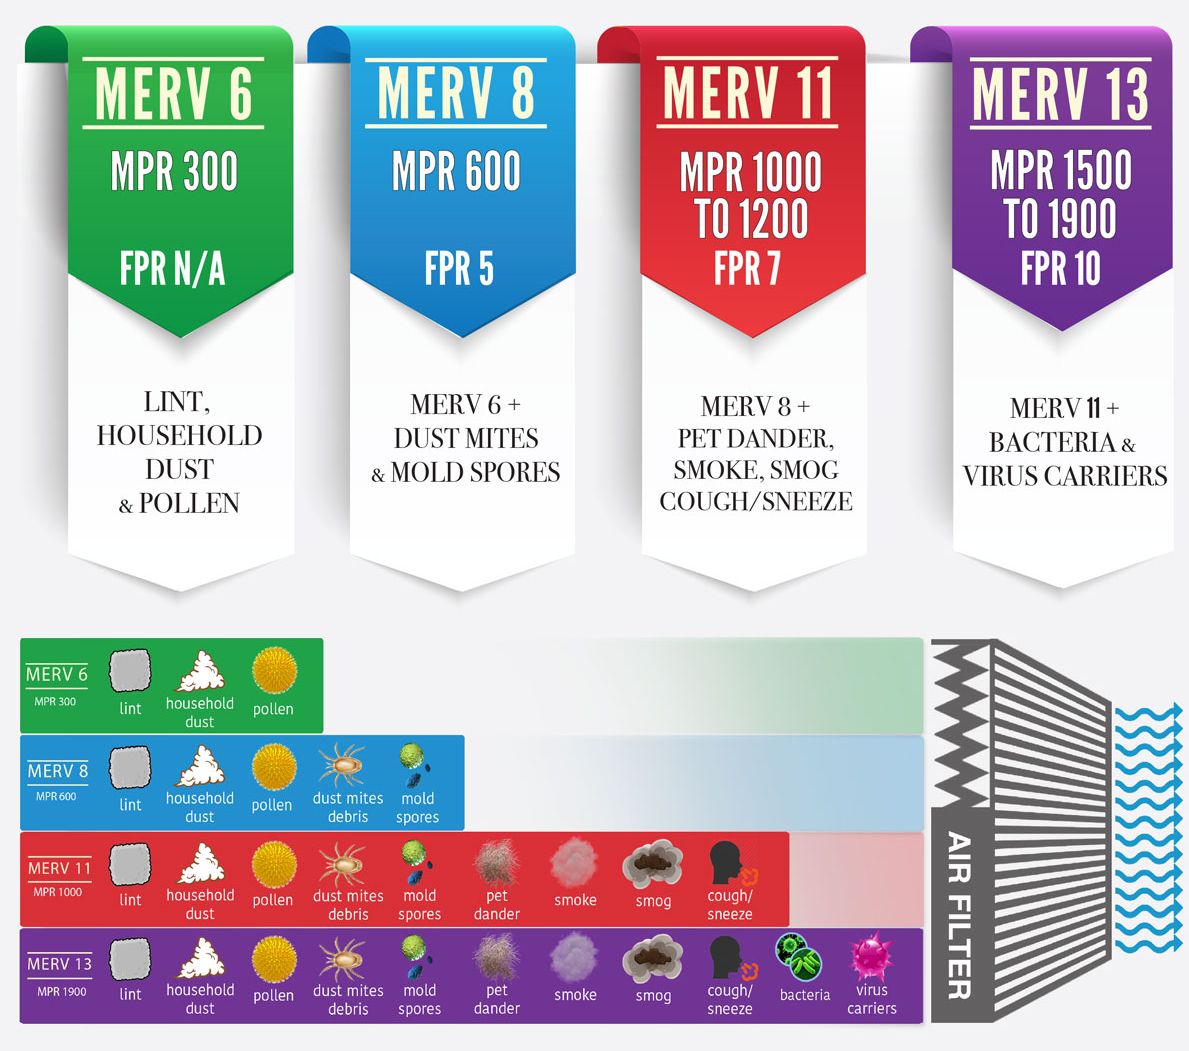
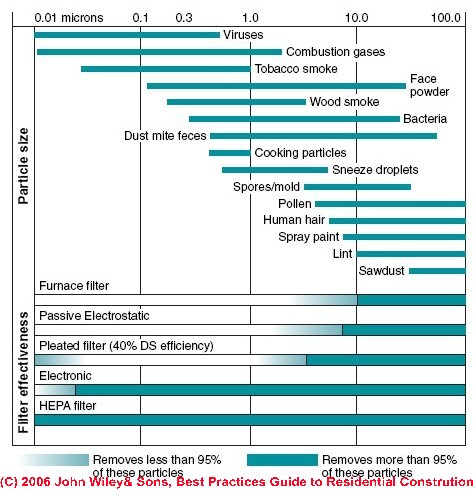
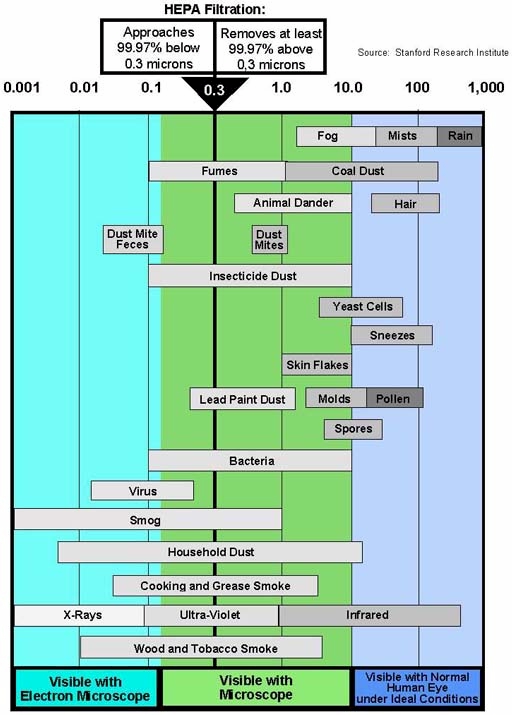
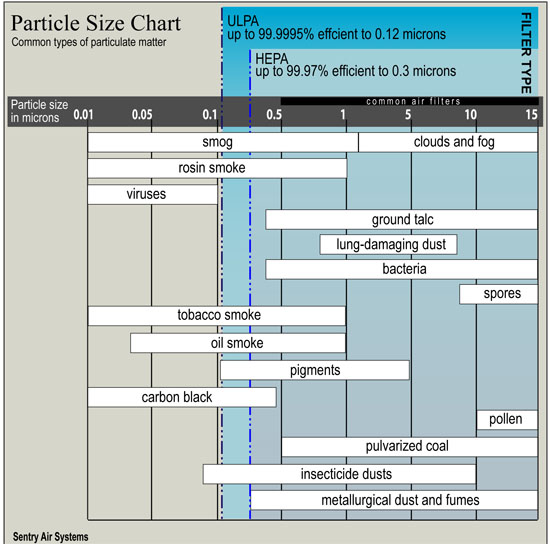
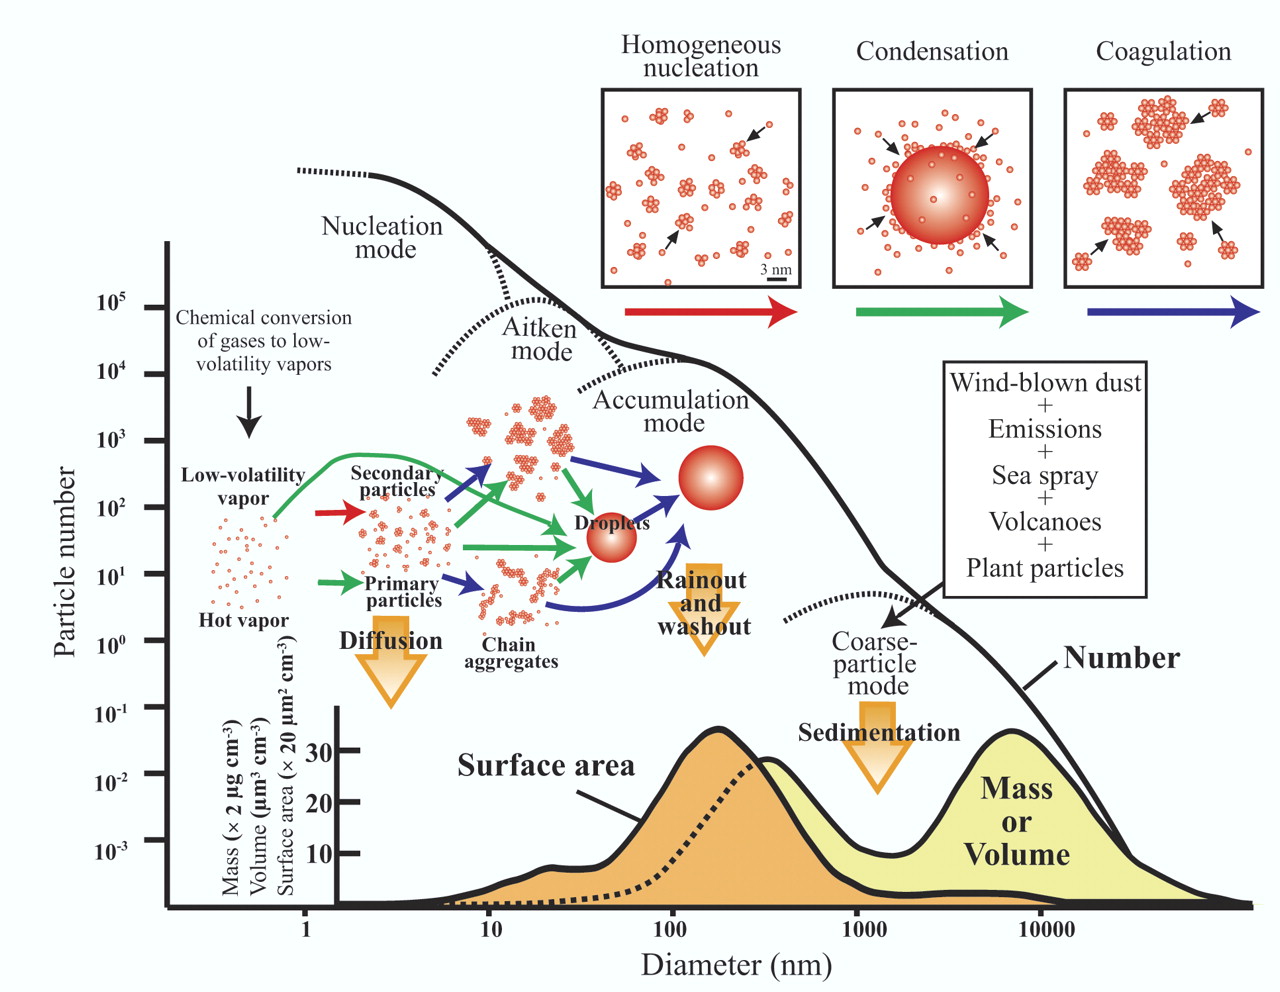
ScanTech Technical Consulting performs indoor air quality tests including particulate matter in the air (residential and commercial) in the 0.3 – 2.5 micron and 2.5 micron + range (PM 2.5 and PM10) in order to evaluate how clean your air is with respect to dust and other fine particles. We also offer formaldehyde and VOC levels testing due to chemicals used in the manufacture of pressed wood flooring, lumber, laminates, glues and other adhesives in your home and factory/office.
More information on formaldehyde can be found here:
https://emfsurvey.com/formaldehyde-indoor-air-pollutant-and-testing/
We can also test for VOCs, (Volatile Organic Compounds) CO2 (Carbon Dioxide) levels and O2 oxygen levels in your home to check ventilation quality. Datalogging over time available to show trends and measure the effects of HEPA filtration and electrostatic air ionization units.
Our background in organic and environmental chemistry, epidemiology, advanced microbiology, medical geology and human physiology makes us uniquely qualified to answer your concerns regarding the invisible environment you breathe every day.
July 2016 ruling by the EPA on the emissions of formaldehyde of wood products produced or imported into the United States:
The following tables and information are from:
Health Effects Notebook for Hazardous Air Pollutants
To convert concentrations in air (at 25°C) from ppm to mg/m3: mg/m3 = (ppm) × (molecular weight of the compound)/(24.45) For formaldehyde which is CH20: 1 ppm = 1.23 mg/m3.

Formaldehyde Regulatory and Health Levels Comparison
Formaldehyde Regulatory & Health Levels Comparison
AIHA ERPG–American Industrial Hygiene Association’s emergency response planning guidelines. ERPG 1 is the maximum airborne concentration below which it is believed nearly all individuals could be exposed up to one hour without experiencing other than mild transient adverse health effects or perceiving a clearly defined objectionable odor; ERPG 2 is the maximum airborne concentration below which it is believed nearly all individuals could be exposed up to one hour without experiencing or developing irreversible or other serious health effects that could impair their abilities to take protective action.
ACGIH STEL–American Conference of Governmental and Industrial Hygienists’ short-term exposure limit expressed as a time-weighted average exposure; the concentration of a substance which should not be exceeded at any time during a workday.
LC50 (Lethal Concentration50)–A calculated concentration of a chemical in air to which exposure for a specific length of time is expected to cause death in 50% of a defined experimental animal population.
NIOSH IDLH–National Institute of Occupational Safety and Health’s immediately dangerous to life or health limit; NIOSH recommended exposure limit to ensure that a worker can escape from an exposure condition that is likely to cause death or immediate or delayed permanent adverse health effects or prevent escape from the environment.
NIOSH REL–NIOSH’s recommended exposure limit; NIOSH recommended exposure limit for an 8- or 10-h time-weighted average exposure and/or ceiling.
OSHA PEL–Occupational Safety and Health Administration’s permissible exposure limit expressed as a time-weighted average; the concentration of a substance to which most workers can be exposed without adverse effect averaged over a normal 8-h workday or a 40-h workweek.