Tag Archives: indoor air quality testing

Radon Gas Testing, Mold and Indoor Air Quality Inspections Dallas Houston Austin

Radon is one of the leading causes of lung cancer

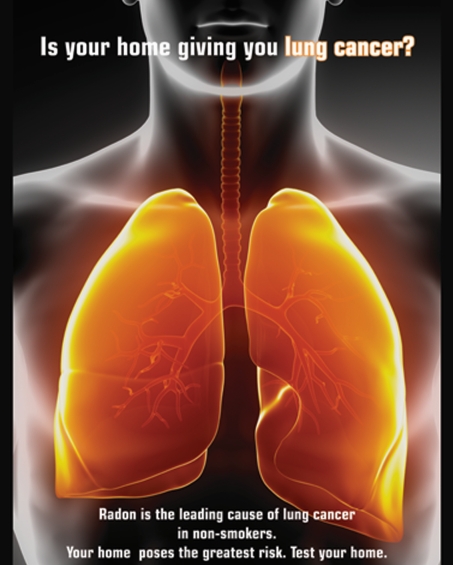
Radon gas in homes is one of the leading causes of lung cancer

Current MAP requirements allow a 25% ground floor sampling variance from the ANSI-AARST testing protocol.  However, if any of the units come back at or above 4 pCi/L, 100% ground floor testing is required. You can find the current radon policy in Chapter 9.5.C of the MAP guide: https://www.hud.gov/sites/documents/4430GHSGG-BM.PDF

Attached is a 2018 radon update from Pat Burke that supplements the existing policy:   Radon Technical Updates Pat Burke November 2018

Multifamily has proposed eliminating the 25% sampling variance and requiring 100% ground floor testing.  If approved, this change would go into effect when the new MAP guide is published.  The guide is still going through review. (from a memo dated Aug 5th, 2020)

The new requirement has now largely passed and is in effect as of this writing (January 1st, 2022) and because of the ongoing pandemic, ScanTech is no longer performing surveys for OCCUPIED multi-family dwellings or nursing facilities. We only perform commercial surveys in unoccupied structures which are typically new builds, though we can still do office buildings under certain conditions such as in conjunction with other forms of indoor air quality testing.  

Biomedical / Environmental Health & Safety Consulting & Field Testing With Industrial Hygiene & Microbiology expertise

Dallas Green Building Clearance Services – Certificate of Occupancy IAQ (Indoor Air Quality) VOC measurements for Dallas Green Building Ordinance Post-Construction with regards to Pre-Occupancy baseline IAQ testing Section 804.2.

In a rush to test your property for radon gas or radioactivity in natural stone such as granite or marble? Did you know that radon is the 2nd leading cause of lung cancer? (Smoking is 1st and radon gas synergistically increases mortality rates for smokers)

While it is not well known, radon gas levels EXCEED EPA action limits of 4 picoCuries/liter (pCi/L) in up to 10 % of all homes in Dallas county with an additional 14 % falling into the marginal range of 2 – 4 pCi/L. This means that 1 out of 4 homes (10 % + 14 % = 24%) in Dallas either have a radon issue or fall into a caution category. Other counties, such as Tarrant, Collin and Denton are not immune either. (see the link below on Radon FAQ from ScanTech for more details)

Example areas of the Metroplex (not a complete or comprehensive list) which have been found by ScanTech testing to have excess radon levels which are statistically higher than the 24 % quoted above include:

  • North Dallas and Far North Dallas
  • Lake Highlands
  • University Park
  • Highland Park
  • Park Cities area
  • Richardson
  • Arlington

ScanTech now has the capability to test and get results within as little as 24 hours of initial deployment using a high quality digital tester.

Our services are both faster and cheaper than competing methods or companies and we have been performing radon testing for homeowners in the DFW area for over 10 years.

Testing is performed by an engineering graduate experienced in radioactivity measurements,  indoor air quality testing including mold inspection, formaldehyde and radon gas testing.

AARST NRPP National Radon Testing Professional Certified

AARST-NRPP Nationally Certified Radon Residential Measurement Provider ID # 108991 RT* including Advanced Multi-Family & Large Buildings Radon Measurement MAMF-2017

*Meets HUD, Fannie Mae, Freddie Mac and GSA requirements

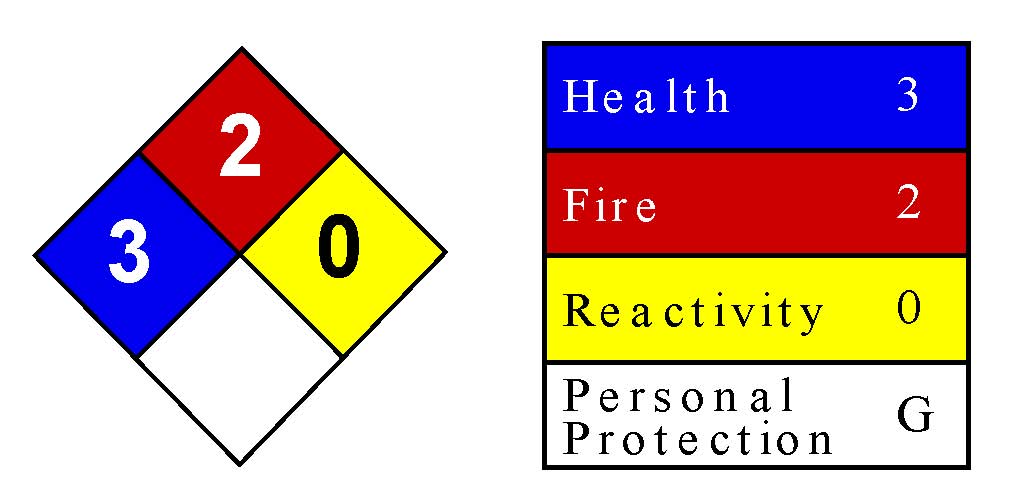
Mold Assessment Consultant – Texas Dept. of Health Service License # MAC1387 (now licensed by TDLR (Texas Dept. of Licensing & Registration)

(Activated charcoal short term radon test kits are accurate as well, but typically require at least 4 business days to get results under best case conditions and a complete kit deployment and pickup service is almost always more expensive due to the additional travel)

Call / text to 214.912.4691 – please include physical address, square footage property and email

More information is available here:

RADON FAQ Dallas /Fort Worth — DFW North Texas Area

http://www.indoorairqualitytestingdallas.com/

http://www.scantech7.com/formaldehyde-indoor-air-quality-testing-services-dallas-fort-worth/

Radon Deaths United States Annually

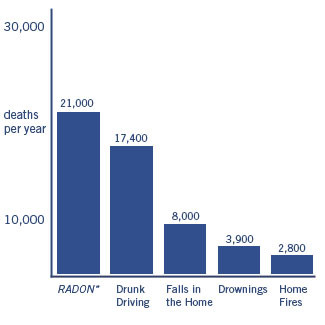
Annual Radon Deaths Updated Chart

Texas CMIS Mold Information Sheet

Cities for radon / air quality inspection services include: Dallas, Austin, Houston, San Antonio, Spring, The Woodlands, Round Rock, Plano, Highland Park, University Park, Park Cities, Arlington, Fort Worth, Grapevine, Frisco, Denton, McKinney, Allen, Lewisville, Irving, Mesquite, Bedford, Euless, Richardson, Coppell, Grand Prairie, Garland, Addison, Farmers Branch, Rockwall, Carrollton, Parker, Rowlett, Lucas, Fairview, Park Cities, Keller, Roanoke, The Colony, Highland Village, Lake Dallas, Corinth, Prosper, Duncanville, Lancaster, Rowlett, Royse City, Trophy Club, Southlake and Hurst. Counties served include Dallas, Collin, Denton, Tarrant and Rockwall County.

*LEGAL NOTICE*

All information on this website either written or implied is the express opinion of ScanTech Technical Consulting. ScanTech Technical Consulting and it’s owners are not responsible or liable for any damages arising from the misuse, misinterpretation or other consequences of the content of this website either in part or in whole. This includes all external weblinks, PDF documents, photos or other references (informational or otherwise) to 3rd parties including government agencies, health organizations, etc.

15770 Dallas Pkwy Suite # 900      Dallas, TX 75248   (Not Accepting Visitors due to C19)

Phone: (214).912.4691      https://emfsurvey.com

ScanTech Technical Consulting: Professional Electromagnetic EMF EMI Testing for Biomedical Implant & Equipment, Indoor Air Quality (IAQ) Testing & Environmental Inspections

COPYRIGHT 2002 – 2022

Indoor Air Quality (IAQ) Testing Services (including chemicals / carcinogens like Formaldehyde) Available – Fast Onsite Results!

Formaldehyde NFPA Diamond from MSDS (Material Safety Data Sheet)

Formaldehyde NFPA Diamond from MSDS (Material Safety Data Sheet)

Dallas IAQ Green Building Clearance Testing for 804.2 Ordinance

Dallas Green Building IAQ Indoor Air Quality Clearance Testing Post-Construction for 804.2 Certificate of Occupancy

ScanTech Technical Consulting performs indoor air quality tests including particulate matter in the air (residential and commercial) in the 0.3 – 2.5 micron and 2.5 micron + range  (PM 2.5 and PM10) in order to evaluate how clean your air is with respect to dust and other fine particles. We also offer formaldehyde and VOC levels testing due to chemicals used in the manufacture of pressed wood flooring, lumber, laminates, glues and other adhesives in your home and factory/office.

More information on formaldehyde can be found here:

https://emfsurvey.com/formaldehyde-indoor-air-pollutant-and-testing/

We can also test for VOCs, (Volatile Organic Compounds) CO2 (Carbon Dioxide) levels and O2 oxygen levels in your home to check ventilation quality. Datalogging over time available to show trends and measure the effects of HEPA filtration and electrostatic air ionization units.

Our background in organic and environmental chemistry, epidemiology, advanced microbiology, medical geology  and human physiology makes us uniquely qualified to answer your concerns regarding the invisible environment you breathe every day.

July 2016 ruling by the EPA on the emissions of formaldehyde of wood products produced or imported into the United States:

https://www.epa.gov/formaldehyde/formaldehyde-emission-standards-composite-wood-products-0#additional-resources

The following tables and information are from:

Health Effects Notebook for Hazardous Air Pollutants

To convert concentrations in air (at 25°C) from ppm to mg/m3: mg/m3 = (ppm) × (molecular weight of the compound)/(24.45) For formaldehyde which is CH20: 1 ppm = 1.23 mg/m3.

Explanation of Formaldehyde Levels

Formaldehyde Regulatory and Health Levels Comparison

Formaldehyde Regulatory & Health Levels Comparison

AIHA ERPG–American Industrial Hygiene Association’s emergency response planning guidelines. ERPG 1 is the maximum airborne concentration below which it is believed nearly all individuals could be exposed up to one hour without experiencing other than mild transient adverse health effects or perceiving a clearly defined objectionable odor; ERPG 2 is the maximum airborne concentration below which it is believed nearly all individuals could be exposed up to one hour without experiencing or developing irreversible or other serious health effects that could impair their abilities to take protective action.

ACGIH STEL–American Conference of Governmental and Industrial Hygienists’ short-term exposure limit expressed as a time-weighted average exposure; the concentration of a substance which should not be exceeded at any time during a workday.

LC50 (Lethal Concentration50)–A calculated concentration of a chemical in air to which exposure for a specific length of time is expected to cause death in 50% of a defined experimental animal population.

NIOSH IDLH–National Institute of Occupational Safety and Health’s immediately dangerous to life or health limit; NIOSH recommended exposure limit to ensure that a worker can escape from an exposure condition that is likely to cause death or immediate or delayed permanent adverse health effects or prevent escape from the environment.

NIOSH REL–NIOSH’s recommended exposure limit; NIOSH recommended exposure limit for an 8- or 10-h time-weighted average exposure and/or ceiling.

OSHA PEL–Occupational Safety and Health Administration’s permissible exposure limit expressed as a time-weighted average; the concentration of a substance to which most workers can be exposed without adverse effect averaged over a normal 8-h workday or a 40-h workweek.

Composition of Dust Particles and Particulate Matter in The Air

When I test for PM2.5 and PM10 which are Fine Particle and Coarse Particle designations used by the EPA, I am often asked what is the nature of this particulate matter. These may also be referred to as TSP (Total Suspended Particulate) or RSP (Respirable Suspended Particulate) matter. While it is very difficult to tell exactly what it is without microscopic analysis and will vary depending on the environment, an educated guess can be made based on what sources are nearby and the potential contribution of those sources based on typical size regimes.

Possible sources are pollen, toxic mold spores, smoke, bacteria, pet dander, construction dust, etc.

There are some useful reference charts that not only talk about the ranges of certain pollutants, but also give an indication of different filtration mediums which are relatively effective in removing these contaminants.


Particulate Matter in Air Quality

Air Filtration with Regard to Particle Size

*NOTE – HEPA (High Efficiency Particulate Air) filters are typically rated at 99.97% efficiency for particles of 0.3 um or larger. At this time, I am not sure that a HEPA filter will remove more than 95% of particles which are 0.01 microns in size as this chart seems to imply.

Also, beware of filters and vacuum cleaners which claim to be “HEPA-like”, “HEPA-type” or “99% HEPA” as these are not true HEPA filters and are often inferior in quality with regard to air filtration efficiency.

BTW – the term DS efficiency mentioned in the Pleated Filter (40% DS ) refers to Atmospheric Dust Spot Efficiency which measures how well a filter removes staining dust from the air.


HEPA Air Filtration Particle Ranges

HEPA Filtration Particle Chart


Particle Filtration Size Chart HEPA vs. ULPA

Particle Filtration Size Chart HEPA vs. ULPA


Characteristics of Particles and Particle Dispersoids

Characteristics of Particles and Particle Dispersoids

This is a fairly technical diagram for general reference use.


Origin of Dust Particulate Matter

Origin of Dust Particulate Matter

Carbon Monoxide Safety Levels and Indoor Air Quality

An important component of indoor air quality testing is measurement of abnormal levels of carbon monoxide.

Carbon monoxide (CO) is a result from all forms of combustible sources, from smoking and wood fires to propane and fuel-powered automobiles. Poisoning of a human subject comes in two forms – short term exposure to high levels which can cause severe illness or death, or longer term exposures at lower levels which may cause chronic symptomatology.

While actual death is relatively rare, there are far more cases that occur with sub-lethal exposures over a broad range of concentrations. (30 – 100 ppm by volume or ppmv) At the lower end (40 – 60 ppmv) headache and low levels of fatigue, and at higher levels (75 – 200 ppmv) nausea, vomiting and especially sleepiness.

Symptoms with Different Blood COHb Levels

Symptoms with Different Blood COHb Levels

Carbon monoxide and oxygen both bond to hemoglobin in the blood and will compete with each other over binding sites, but CO has the advantage as it binding sites have an affinity or preference of binding with CO that is 200 times greater than O2. (atmospheric oxygen) The result is decreased oxygen carrying capacity in the blood with the consequent neurological symptoms of oxygen deprivation as listed above as well as reduced oxygen to other body tissues. It also binds to intracellular proteins such as tryptophan oxidase, cytochrome oxidase,  myoglobin, and dopamine hydroxylase which may cause extra-vascular effects.

The result of CO combining with hemoglobin is to form carboxyhemoglobin. (COHb) Exposure to CO can be evaluated by measurement of the levels of COHb in the blood which is typically less than 1% for unexposed individuals. This is the % amount of blood hemoglobin bound with carbon monoxide. Cigarette smokers typically have a level of 3% – 8%. OSHA has a permissible exposure limit (PEL) of 50 ppmv over an 8 hour time-weighted average (TWA) in which case an individual would have a COHb level of approximately 5%. At 100 ppmv, it would be over 10%.

COHb Levels Resulting from Exposure Duration

COHb Levels Resulting from Exposure Duration

Even low level carbon monoxide exposures can cause issues in compromised human subjects such as those with cardiovascular disease. The lowest level at which COHb can show as a physiological symptom is 3 %- 4 % COHb. At 6 % COHb, arrhythmia may be induced in exercising patients with coronary artery disease with a risk of sudden death. There is also evidence that suggests that carbon monoxide exposure may contribute to atherosclerosis.

Studies have shown that those with flu-like or neurological symptoms had COHb levels of 10% or greater. (24% and 3 % respectively. Sub-acute carbon monoxide poisoning commonly goes unrecognized and is not diagnosed because it mimics other conditions and is present at the residence / workplace – not the doctor’s office.

Those at higher risk include pregnant women, young children, the elderly, individuals with conditions that already compromise O2 availability, and those that use certain medications and drugs.

For a discussion of CARBON DIOXIDE poisoning which is an entirely different phenomena, see the post here:

New Homes and Carbon Dioxide Levels: The Overlooked Indoor Air Quality Health Hazard

If you live in the Dallas / Fort Worth, Houston or Austin metropolitan areas and suspect carbon monoxide / dioxide poisoning or other indoor air quality issues, then contact ScanTech Technical Consulting for an evaluation.